Grip Norms by Age & Sex
"What should my grip be?" has a two-part answer: a number from a percentile table, and a healthy dose of skepticism about what that number means. This page explains how grip norms are built, how to read them without fooling yourself, and why the average for your age is a benchmark to compare against — not a target to settle for.
What the evidence supports
- Grip strength follows a well-characterized life-course curve: it peaks in the 30s, holds through the 40s, then declines, with the slope steepening after roughly age 60 (Dodds et al., PLOS One, 2014).
- Men average roughly 15–20 kg more than women at every adult age, driven mostly by lean body mass and height.
- Meta-analytic reference values exist for the Jamar dynamometer, the standard device (Bohannon et al., Physiotherapy, 2006).
What remains uncertain
- Norms differ measurably between countries and cohorts, so a table built in one population is an approximation in another (Dodds et al., Age and Ageing, 2016).
- Device and protocol choices (handle position, trials averaged versus best) shift values by several kilograms.
- No single percentile has been validated as a clinical action line across all ages.
Evidence last reviewed: August 15, 2026. Conclusions may change as new research is published.
Product picks are generic categories, not brands. We may earn a commission on Amazon or iHerb purchases at no cost to you — this never changes our evidence conclusions. Full disclosure
Hand-grip dynamometer
Can track grip-strength performance over time when measured consistently.
⚠️ Readings can be affected by pain, arthritis, technique, and device variation; a result is not a diagnosis.
Check price on Amazon →Where the Numbers Come From
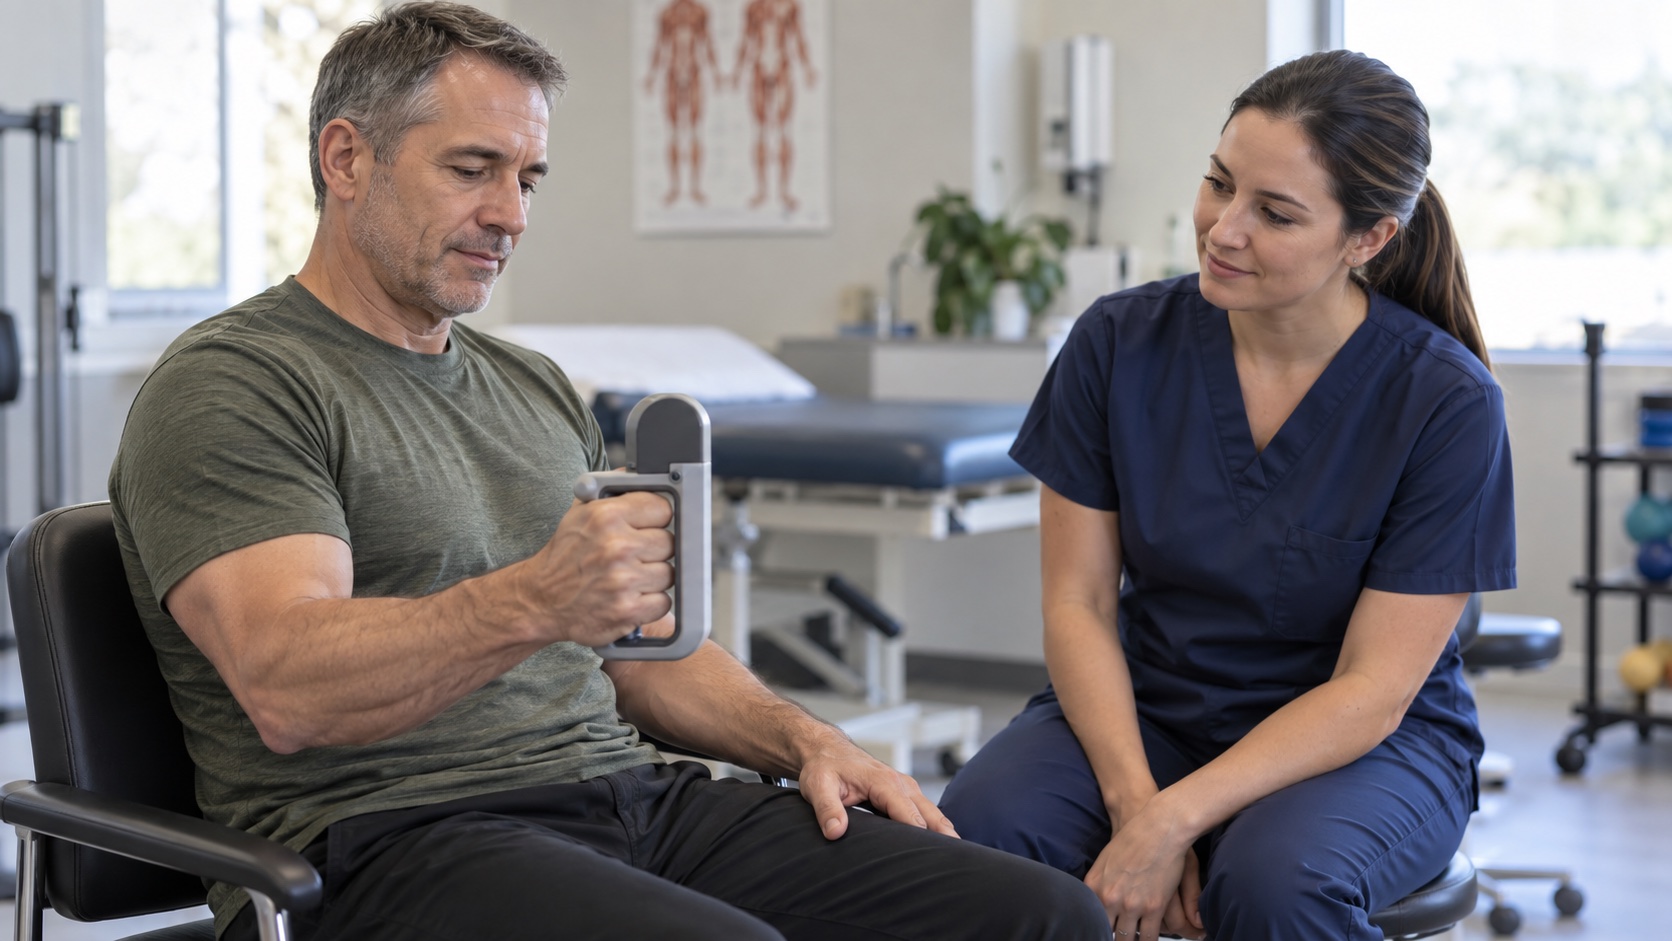
Every grip table you will see traces back to the same procedure. A seated person, elbow flexed to 90 degrees, forearm neutral, squeezes a Jamar-style hydraulic dynamometer as hard as possible for about three to five seconds. Three trials per hand, the best effort recorded. That protocol — boring as it sounds — is what makes numbers comparable across studies, and it is why your casual test at home should copy it: same chair, same posture, same handle position, or your trend will contain noise instead of signal. The quarterly audit protocol applies the same rule to every marker it tracks.
The reference values themselves come from pooling. Bohannon and colleagues' descriptive meta-analysis (Physiotherapy, 2006) aggregated Jamar data from thousands of adults, and the Medical Research Council's life-course analyses by Dodds and colleagues added fifty-thousand-plus measurements across twelve British cohorts (PLOS One, 2014), later extended to a global comparison showing how much norms shift between countries (Age and Ageing, 2016). The chart below distills the consistent shape those datasets share.
How to Read a Percentile Table
A percentile answers one precise question: what fraction of people your age and sex are weaker than you? The 50th percentile is the middle of the pack — half above, half below. The 10th percentile means only one person in ten scores lower. None of these rows is a verdict; they are a map of where you sit. The table below is approximate, rounded to the nearest kilogram, and pooled from large normative samples — use it for placement, not for grading yourself against a decimal point.
| Group | 10th percentile | 50th (median) | 90th percentile | How to think about it |
|---|---|---|---|---|
| 👨 Men, 30s | ≈38 kg | ≈48 kg | ≈60 kg | At the peak of the curve; a score here is your ceiling reference |
| 👨 Men, 50s | ≈33 kg | ≈44 kg | ≈56 kg | Most men have drifted only slightly from peak |
| 👨 Men, 70s | ≈24 kg | ≈34 kg | ≈44 kg | The 10th percentile sits near frailty cut-points worth knowing |
| 👩 Women, 30s | ≈22 kg | ≈29 kg | ≈36 kg | Peak of the curve; same framing as men |
| 👩 Women, 50s | ≈19 kg | ≈26 kg | ≈33 kg | Most women have drifted only slightly from peak |
| 👩 Women, 70s | ≈14 kg | ≈21 kg | ≈28 kg | The 10th percentile brushes the EWGSOP2 threshold of 16 kg |
Two practical reads matter more than any cell. First, sitting below the 10th percentile for your age and sex is the point where the decline page says to take the trend seriously. Second, where you sit relative to younger groups matters too: a 70-year-old scoring at the 50th percentile of 50-year-olds is functionally younger than their calendar age — and that gap is trainable.
Meditation cushion or supportive chair accessory
May make a meditation practice more physically comfortable.
⚠️ None expected; meditation can be difficult or unsettling for some people and is not a replacement for mental-health care.
Check price on Amazon →What "Average for 60" Really Means
The average is the single most misread number in grip testing. It is not the healthy level, the recommended level, or the level to aim for. It is the middle of a population that includes smokers, desk workers, people recovering from illness, and everyone who has never trained a day in their life. If you are reading a longevity site and lifting weights twice a week, the relevant comparison group is not "all 60-year-olds" — it is "60-year-olds with your habits," and they sit well above the median.
The same logic runs the other way. Scoring at the average while declining quarter after quarter is not reassuring; the norm tells you nothing about your slope. A person who was at the 80th percentile at 55 and the 40th at 65 has lost ground the average cannot see. That is the deeper argument of the parent topic: the trend is the test. Averages are cross-sections; your health is a time series.
The Dominant-Hand Rule and How to Test
Your dominant hand is typically about 10% stronger — the gap is small in consistent trainers and larger in people who have never trained. What matters is not the gap itself but changes in it: a suddenly widening asymmetry can reflect an injury, nerve issue, or joint problem in one hand, and is one of the red flags covered on the decline page. Record both hands separately, every time.
The test protocol that makes all of this comparable, adapted from the research standard:
- 🪑 Seated, elbow at 90 degrees, forearm pointing forward, wrist neutral — the position the norms were built in.
- ✊ Three squeezes per hand, a few seconds each, about 30–60 seconds apart; keep the best.
- 📅 Same conditions every quarter — same dynamometer, same handle setting, same time of day — or the comparison is fiction.
Adjusting for Body Size
Grip strength scales with body size: taller, heavier people generate more force, which is why some reference systems adjust for height or body mass. The frailty phenotype definition that made grip famous (Fried et al., Journals of Gerontology, 2001) does exactly this — it flags the weakest 20% within a sex-and-body-mass band rather than applying one absolute cutoff to everyone. The European sarcopenia criteria (Cruz-Jentoft et al., Age and Ageing, 2019) take the opposite route, using simple absolute floors — below 27 kg for men, 16 kg for women — because in the clinic a single number travels better than a correction formula. Neither approach invalidates the other; they are two lenses on the same signal. If you are very large or very small for your sex, read your percentile with that in mind before you read too much into it. Whichever lens you use, do not let the adjustment talk you out of the trend: absolute kilograms falling on a consistent protocol mean the same thing whether or not the table is size-corrected.
📏 Same conditions, or no comparisons
The single biggest source of false alarm in self-testing is protocol drift — a different chair height, a rushed effort, a dynamometer you hold differently than last quarter. Decide your setup once, write it down next to the numbers, and never vary it. A noisy measurement can look exactly like a decline.
Questions, Answered Briefly
- 🤔 My non-dominant hand is much weaker — is that bad? A gap up to about 10% is typical. More than that, or a gap that widens quickly, deserves attention: unilateral weakness is a different signal than an overall low score.
- 📏 Do I need a dynamometer, or can I estimate? Estimates (hanging time, jar-opening difficulty) are directional at best. An inexpensive dynamometer — the Jamar-style hydraulic gauge — costs roughly the price of two physiotherapy copays and turns a feeling into a number.
- 🧮 Which percentile should I worry about? Below the 10th for your age and sex is the conventional attention line, and the absolute floors of 27 kg (men) and 16 kg (women) flag the sarcopenia pathway. Between those and the median, the trend matters more than the position.
- 🏋️ My grip is average but I lift — am I doing something wrong? Not necessarily. Some people's grip responds slowly even while their deadlift climbs. If it bothers you, the building-grip page has the minimal toolbox.
- 🌍 I found a different table with different numbers. That is expected — norms vary by country, device, and cohort. Pick one table, stick with it, and track change; absolute agreement between tables was never the point.
- 🔄 Do measurements wander across the year? Slightly — sleep, stress, and recent training all nudge a single score by a kilogram or two, which is another reason the quarterly trend, taken under identical conditions, is the number to trust rather than any individual reading.
The Bottom Line
- Grip norms are well-established: peak in the 30s, slow drift through the 50s, steeper decline after 60, with men roughly 15–20 kg ahead of women at every age.
- Percentiles tell you where you sit, not how you're doing — the median includes everyone who never trained.
- The average for your age is a benchmark, not a goal; where you sit relative to younger decades is the more useful comparison.
- Test like the studies do — seated, 90-degree elbow, three trials, best kept, same conditions every quarter.
Related Topics
- Bohannon et al., "Reference values for adult grip strength measured with a Jamar dynamometer: a descriptive meta-analysis," Physiotherapy (2006)
- Dodds et al., "Grip strength across the life course: normative data from twelve British studies," PLOS One (2014)
- Dodds et al., "Global variation in grip strength: a systematic review and meta-analysis of normative data," Age and Ageing (2016)
- Leong et al., "Prognostic value of grip strength: findings from the Prospective Urban Rural Epidemiology (PURE) study," The Lancet (2015)
- Fried et al., "Frailty in older adults: evidence for a phenotype," The Journals of Gerontology Series A (2001)
- Cruz-Jentoft et al., "Sarcopenia: revised European consensus on definition and diagnosis," Age and Ageing (2019)