Designing for belonging
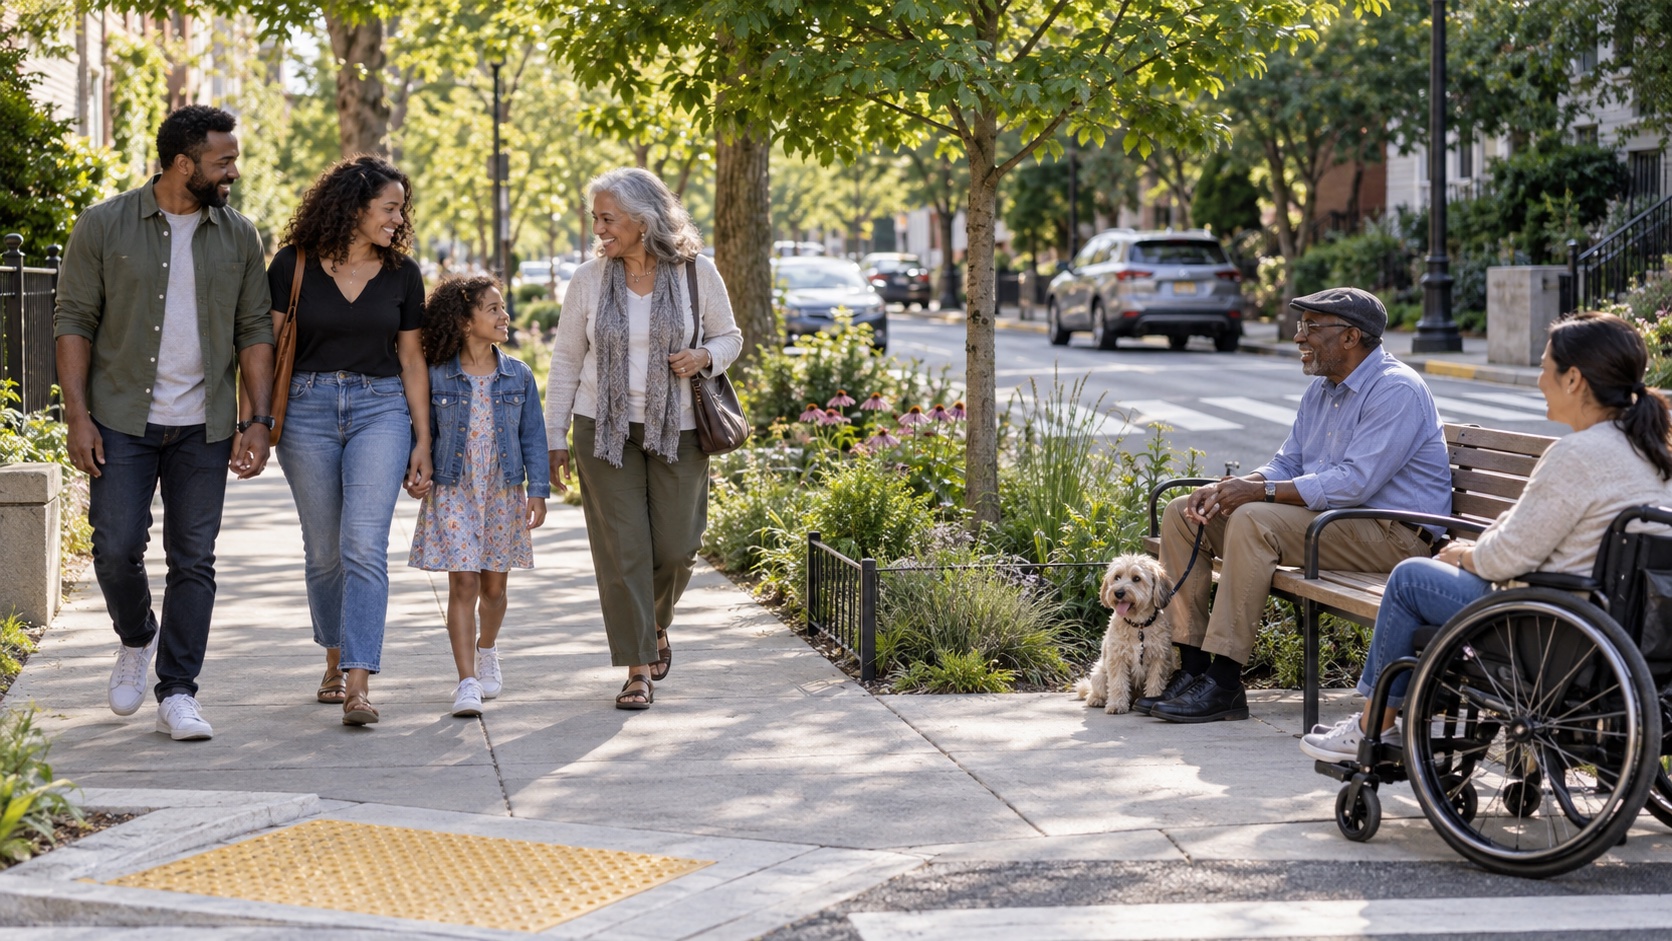
Belonging is not only chosen; it is engineered. The street grid, the green space, and the nearest third place set the default number of human encounters in your day — and encounter count is the raw material every other page in this topic builds on. This page assembles the built-environment evidence, then hands you a fifteen-minute audit you can run on your own block.
What the evidence supports
- Four design features — street connectivity, residential density, transit density, and parks — each independently associate with more physical activity across 14 cities (Lancet, 2016).
- Neighborhood matters causally: moving to a lower-poverty area reduced diabetes and extreme obesity in a randomized voucher experiment (NEJM, 2011).
- Greenery near home associates with lower mortality — 12% per 250 meters of greenness (Environmental Health Perspectives, 2016).
What remains uncertain
- The built-environment evidence is mostly about activity and metabolic health, not measured belonging — encounter count is an inference, not a measurement.
- People select neighborhoods; most studies are observational even when well adjusted.
- Third-place effects rest on classic theory and cohort patterns rather than trials.
Evidence last reviewed: August 15, 2026. Conclusions may change as new research is published.
The Block Is the Unit
The parent topic eulogized the third place; this page supplies the numbers. The basic mechanism is encounter count: every day, your neighborhood either generates a stream of casual human contacts — the nod, the bench conversation, the familiar face at the counter — or it does not. Those contacts are the weak-tie cloud that feeds mood, information, and eventually the strong ties. A neighborhood that generates zero encounters by design — garage-to-freeway, driveway-to-cubicle — quietly removes the substrate on which belonging grows. Design is not destiny; it is the default setting.
What the Built-Environment Literature Shows
The flagship study is the International Physical Activity and Environment Network analysis: 6,822 adults in 14 cities across five continents, in which four design features — residential density, street connectivity, transit density, and number of parks — each independently predicted more physical activity, with neighborhoods scoring high on all four associated with roughly an hour and a half more activity per week (Lancet, 2016). Walkability is not just a preference: when researchers compare how people move in walkable versus unwalkable neighborhoods, the environment explains walking above and beyond stated attitudes (Social Science & Medicine, 2007). And the causal headline belongs to Moving to Opportunity, a randomized housing-voucher experiment in which families moved to lower-poverty neighborhoods showed meaningfully lower rates of diabetes and extreme obesity years later (New England Journal of Medicine, 2011). Activity is the gateway drug here: people who walk their neighborhood meet their neighborhood — the encounters are the unmeasured second effect.
Green Space and Trees as Social Infrastructure
The greenness findings deserve their own section because the mechanism is social as much as physiological. In a national cohort of US women, each 250 meters of greenness near home associated with 12% lower all-cause mortality (Environmental Health Perspectives, 2016). The social half comes from the classic Chicago public-housing work: buildings with more surrounding vegetation had substantially fewer crime reports and more residents socializing outdoors than identical buildings surrounded by pavement (Environment and Behavior, 2001) — trees and grass draw people out, and people out becomes people known. Green space is the cheapest social magnet a city owns: it needs no staff, no program, and no admission fee, which is exactly the third-place profile the next section describes.
Third Places, Measured
Ray Oldenburg's The Great Good Place (1989) defined the third place — neither home nor work — and its criteria double as a diagnostic: free or cheap, within walking distance, regulars who recognize you, and conversation as the main activity. Putnam's Bowling Alone (2000) then documented what happens when such places thin out: the famous finding was not that bowling disappeared but that bowling alone replaced bowling in leagues — the same activity, minus the belonging. The longevity translation from the attendance evidence: a congregation is a third place with a schedule, and its health associations are a third-place finding wearing religious clothing. The measurable question for your own life is blunt: what is the nearest place where you are a regular, and can you walk there?
The Auditable Checklist: Score Your Block
The literature reduces to a fifteen-minute audit you can run this week. From your front door, can you walk to, within fifteen minutes:
- 🪑 A public place to sit? A bench, a square, a shaded stoop — somewhere being outside is not a transaction.
- ☕ A third place with regulars? A café, library, barbershop, community center, or park where faces repeat.
- 🌳 Green space? Trees, a park, a greenway — the social magnet with no admission fee.
- 🚶 A route you would walk for pleasure? Connected streets, not just a highway shoulder.
- 👵 An intergenerational venue? A library, school, or community garden where ages mix — the Blue Zones page explains why that feature matters.
Score zero out of five and the evidence says your environment is working against you — which makes the deliberate compensations in Building Your Tribe a higher priority, not a luxury. Score four or five and your neighborhood is quietly doing daily maintenance on your social health.
| Design lever | What it does | Evidence |
|---|---|---|
| 🚶 Walkable grid & connected streets | Each design feature independently tied to more daily activity across 14 cities (Lancet, 2016) | Good |
| 🌳 Green space near home | 12% lower mortality per 250 m greenness (EHP, 2016); greener public housing sees fewer crime reports (Environ Behav, 2001) | Good |
| 🏠 Access to lower-poverty neighborhoods | Randomized voucher moves cut diabetes and extreme obesity (NEJM, 2011) | Good |
| ☕ Third place within walking distance | Classic theory plus cohort patterns; the venue for regulars and conversation (Oldenburg, 1989; Putnam, 2000) | Moderate |
| 🏘️ Shared & intergenerational housing | Cohousing and students-in-care-home programs show promise; mostly qualitative evidence so far | Limited |
| 🪑 Benches, porches, stoops | Draw residents outdoors and slow the street; observational support | Limited |
🏘️ You are your block's co-designer
You do not need a zoning permit to change your block's encounter count. The bench in the front yard, the dog-walk loop at a fixed hour, the block party, the library card that makes you a regular — these are the individual-scale versions of everything this page describes, and they compound the way the cohort benefits do: slowly, then unmistakably. Policy does the heavy lifting, but the margins are yours.
What You Can Change vs What You Cannot
The honest division of labor. You cannot rebuild your street grid, and moving is not on the table for most people — though if it is, the MTO experiment says the neighborhood deserves real weight in the decision. What you can change: your routes (choose the walkable one, and walk it daily — the implementation-intentions protocol makes that automatic), your venues (become a regular somewhere walkable), and your micro-infrastructure (the bench, the porch, the garden — using the environment-design protocol's logic on your own frontage). The boundary honesty: individual effort cannot fully compensate for a car-dependent built form, which is why the same evidence that grades your block also grades your city — and why showing up to a planning meeting is, on this site's logic, a longevity intervention.
Questions, Answered Briefly
- 🏠 Do I have to move to a walkable neighborhood? No — but the randomized voucher evidence says environment matters causally for health, so if a move is on the table, give the block real weight in the decision.
- ☕ What is the highest-value change? One walkable third place where you become a regular. It converts the whole topic — rhythm, weak ties, obligation — into a single habit.
- 🏘️ Are suburbs doomed for belonging? They set a harder default, not an impossible one — the commute is the tax, and the compensation is deliberate containers. Putnam's data describe the drift, not the destiny.
- 🌱 What if my block has nothing? Micro-interventions first — the bench, the loop, the garden — and the digital and interest-based containers in Building Your Tribe while the physical ones grow.
The Bottom Line
- Belonging is partly infrastructure. The street grid, greenery, and third places set your daily encounter count.
- The evidence is strongest for activity and greenness — walkability and green space have cross-city and cohort data; belonging itself remains an inference.
- Neighborhoods are causal, not cosmetic — the randomized Moving to Opportunity experiment proves the point.
- Run the fifteen-minute audit. Five walkable features, scored honestly, tell you how hard your environment is working — or not.
Related Topics
- Sallis et al., "Physical activity in relation to urban environments in 14 cities worldwide: a cross-sectional study," Lancet (2016)
- Frank, Saelens, Powell & Chapman, "Stepping towards causation: do built environments or neighborhood and travel preferences explain physical activity, driving, and obesity?" Social Science & Medicine (2007)
- Ludwig et al., "Neighborhoods, obesity, and diabetes — a randomized social experiment," New England Journal of Medicine (2011)
- James, Hart, Banay & Laden, "Exposure to greenness and mortality in a nationwide prospective cohort study of women," Environmental Health Perspectives (2016)
- Kuo & Sullivan, "Environment and crime in the inner city: does vegetation reduce crime?" Environment and Behavior (2001)
- Oldenburg, The Great Good Place, Paragon House (1989)
- Putnam, Bowling Alone: The Collapse and Revival of American Community, Simon & Schuster (2000)
- Jacobs, The Death and Life of Great American Cities, Random House (1961)