The Sodium Audit & Potassium Build
Most of the sodium in your diet never touches a salt shaker. It arrives hidden in bread, sliced meat, canned soup, and the condiments shelf — about 70% of it, by the standard estimates. This page is the audit: how to find the salt that's hiding, how to cut it in steps your palate can survive, and how to build the potassium side of the ledger that does the balancing.
What the evidence supports
- Cutting sodium from high to low intake lowers systolic pressure by roughly 5–11 mmHg in trials, with bigger responses in hypertensive and salt-sensitive people.
- Increased potassium intake lowers blood pressure by about 2–4 mmHg and blunts sodium's effect.
- Roughly 70% of U.S. sodium intake comes from packaged, prepared, and restaurant food — not the shaker.
What remains uncertain
- Individual salt sensitivity varies widely — the audit below is how you find out which type you are.
- The sodium:potassium ratio's added predictive value over its two halves is still debated — treat it as a compass, not a verdict.
Evidence last reviewed: August 13, 2026. Conclusions may change as new research is published.
Where the Salt Actually Lives
The average American takes in about 3,400 mg of sodium a day — roughly 50% above the 2,300 mg standard limit, and more than double the 1,500 mg the American Heart Association sets as the ideal for most adults. The uncomfortable part: almost none of it is being poured from your own shaker.
- 🏭 The factory, not the shaker — about 70% of intake arrives already inside packaged, prepared, and restaurant food.
- 🧂 The shaker is the small player — salt added at the table and in home cooking accounts for roughly 15%.
- 🌿 The naturally occurring slice — another ~15% is sodium that foods simply contain, meat and vegetables included.
- 🍜 Restaurant meals — a single restaurant plate often carries 1,000–2,000 mg; one meal can be a whole day's budget.
- 📊 The trendline — intake has drifted down slowly for a decade, but at current pace the average American would still be over the limit for years to come; an individual audit beats waiting for the food supply.
Product picks are generic categories, not brands. We may earn a commission on Amazon or iHerb purchases at no cost to you — this never changes our evidence conclusions. Full disclosure
Meal-prep containers
May lower the practical friction of preparing meals ahead.
⚠️ None expected; avoid treating meal-prep as an all-or-nothing dietary rule.
Check price on Amazon →The Label Audit Method
Finding hidden sodium is a label skill, and it's learnable in about ten minutes. The method, in order:
- 🏷️ Read mg, not the percent — sodium is listed in milligrams per serving; that's the currency. Percentages are relative to a 2,300 mg day and easy to misread.
- 📦 Check the serving size first — "1 serving" may be a third of the package you'll actually eat. Multiply mg by realistic servings, not label servings.
- 🖐️ The 5% trick — 5% daily value (115 mg) or less per serving is low sodium; 20% (460 mg) or more is high. One glance ranks an entire shelf.
- 🛒 The shopping filter — on a grocery run, compare two brands of the same product and buy the lower-mg column. The swap shopping list is the whole strategy.
- 📝 Week one: log, don't change — write down the mg for everything you eat for a week, no changes. The audit needs your honest baseline, not your guilt.
The Hidden-Sodium Roster
The same foods hide the same sodium in kitchen after kitchen. Typical ranges from USDA FoodData Central — but brands vary twofold, so read your own labels:
| Food | Serving | Sodium | Verdict |
|---|---|---|---|
| 🍞 Bread | 1 slice | 100–230 mg | Moderate Adds up before anything goes on it |
| 🥪 Deli turkey or ham | 2 oz (~4 slices) | 500–700 mg | Severe A sandwich-sized hit |
| 🥣 Canned soup | 1 cup | 600–900 mg | Severe Often the whole day's budget |
| 🍣 Soy sauce | 1 tbsp | 900–1,000 mg | Severe The quietest salt bomb in the kitchen |
| 🥗 Salad dressing | 2 tbsp | 250–450 mg | Moderate The salad's saboteur |
| 🥡 Frozen dinner | 1 tray | 700–1,400 mg | Severe Read before the microwave |
Two slices of toast — before anything goes on them — are already ~10% of a 2,300 mg day. That's the point: sodium hides in foods that don't taste salty. Rotisserie chicken, pizza, and breakfast cereal round out the usual suspects — the roster is long, but your week-one log will name your personal top three within days.
The Four-Week Reduction Plan
Cutting from 3,400 to 1,500 mg overnight is how this fails: everything tastes like cardboard, adherence dies by day four, and the rebound is worse than the original diet. The palate resets over three to six weeks, and the plan respects that pace — steps, not cliffs.
- 🪜 Steps, not cliffs — cut roughly 500–1,000 mg per week, not 2,000 at once. The taste buds need time to recalibrate.
- 🔁 Swap, don't remove — replace the salted version with a lower-salt version. Deletion is how diets die; substitution is how they survive.
- 🍳 Cook the week — one batch of no-salt-added soup or sauce covers several meals and removes several label decisions.
- 🏷️ Know the label terms — "sodium-free" (under 5 mg), "very low sodium" (35 mg or less), "low sodium" (140 mg or less), and "no salt added" (no salt in processing — the food may still contain natural sodium). The terms are regulated; the numbers decide.
- 📉 Judge at week 4 — run a 3-day re-check against your baseline from the measurement page. Sodium's effect shows within one to two weeks for most responders.
| Week | Move | Expected cut | Verdict |
|---|---|---|---|
| Week 1 | Audit only — log mg from labels, change nothing | Your honest number | Good The foundation |
| Week 2 | Swap the top three — bread, deli meat, canned soup | −800 to −1,500 mg/day | Good The big cut |
| Week 3 | Kitchen swaps — no-salt-added cans, homemade sauces, condiment downgrades | −500 to −1,000 mg/day | Good The steady cut |
| Week 4 | Palate work — restaurant strategy, cooking with acids and herbs | −300 to −500 mg/day | Moderate The finish |
🧠 The palate moves slower than the plan
Week 2 will taste bland. That's the reset working, not the plan failing. Herbs, acid, and heat fill the gap while your tongue recalibrates — the Low-Sodium Flavor page is the toolkit.
The Potassium Side of the Ledger
Potassium nudges the kidneys to excrete sodium and relaxes blood vessel tone — the physiology lives in the Blood Pressure science topic. Operationally, the question is simpler: are you eating enough of the foods that carry it?
- 🎯 The honest target — the WHO recommends 3,500+ mg/day and the DASH pattern aims at ~4,700, but most adults sit around 2,600. Closing half the gap beats chasing the top number.
- 🥗 Food, not pills — food potassium arrives with fiber, nitrate, and volume; over-the-counter supplements are capped at 99 mg per pill anyway, which is almost not worth the bottle.
- 🧂 It pairs with the cut — potassium's blood pressure effect shows up best against a high-sodium background; the two levers are one lever.
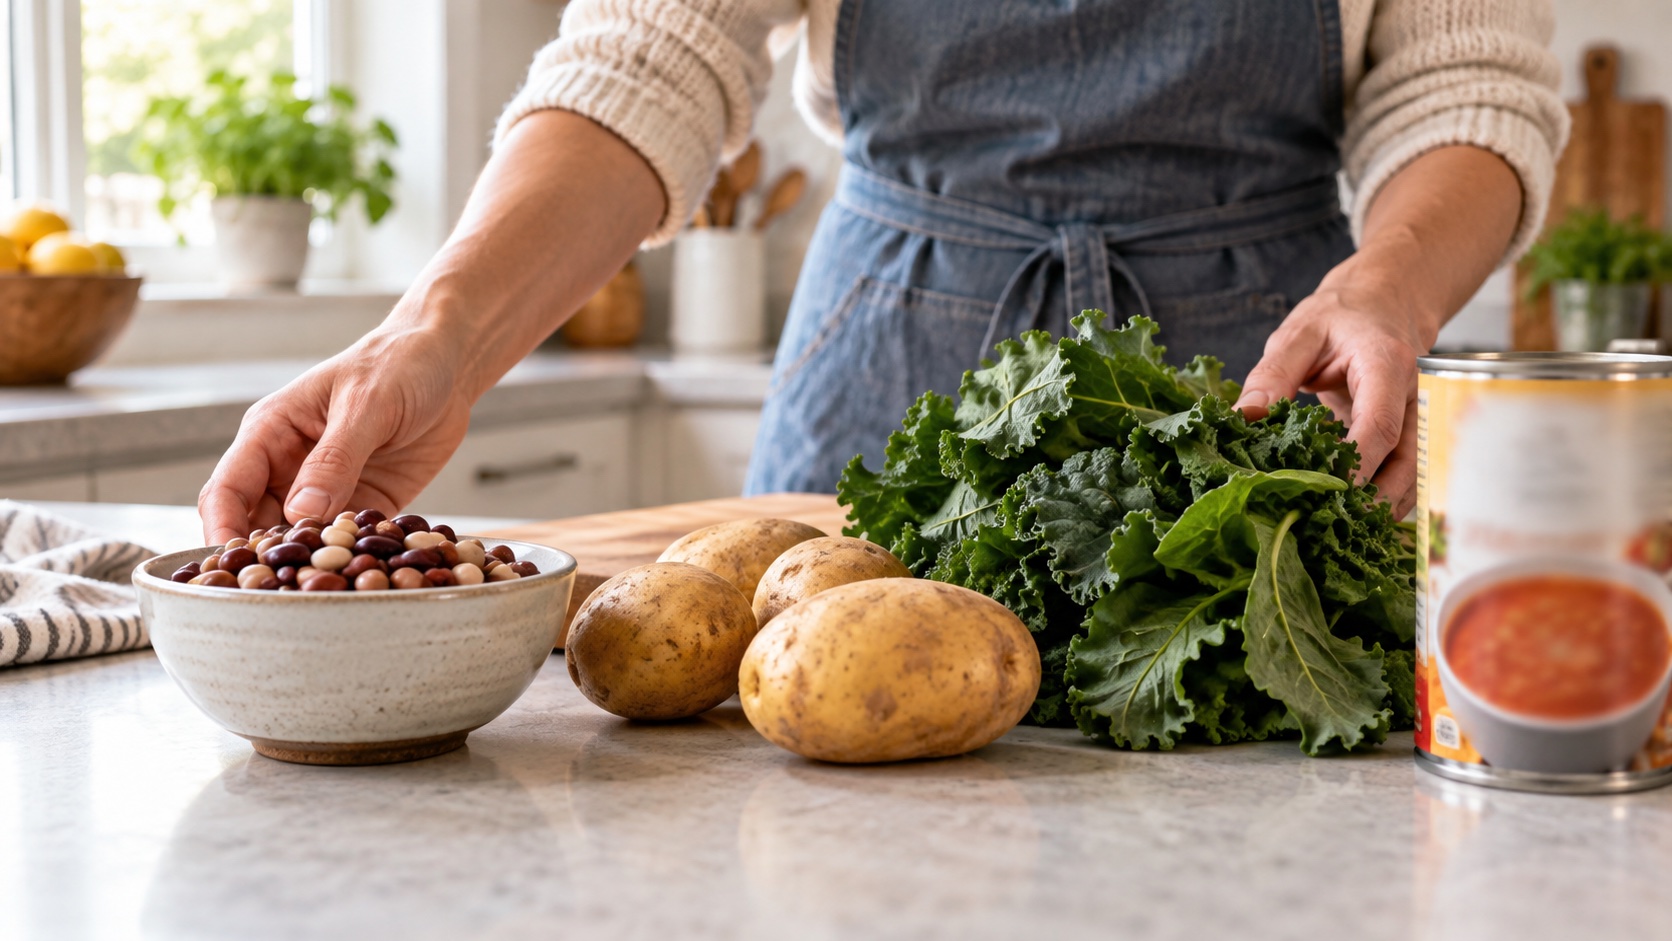
- 🧺 A sample day hits the target — beans in a lunch bowl, a potato with dinner, spinach in the morning eggs, and a banana as a snack lands near 3,500 mg without a single pill.
| Food | Serving | Potassium |
|---|---|---|
| White beans | 1 cup, cooked | ~1,000 mg |
| Baked potato, with skin | 1 medium | ~925 mg |
| Cooked spinach | 1 cup | ~840 mg |
| Lentils | 1 cup, cooked | ~730 mg |
| Avocado | ½ fruit | ~490 mg |
| Salmon | 3 oz | ~490 mg |
| Banana | 1 medium | ~420 mg |
USDA values, rounded. Beans and potatoes quietly out-deliver the famous banana — and a cup of cooked spinach carries more potassium than most sports drinks advertise in an entire bottle.
Who Should Not Load Potassium
Your kidneys fine-tune potassium, keeping blood levels in a narrow band. Kidney disease or certain medications break that thermostat — and that changes the whole recommendation:
- 🫘 Kidney disease caution — with reduced kidney function (or on dialysis), potassium can accumulate to dangerous levels. Clinician guidance first, always.
- 💊 Medication check — ACE inhibitors, ARBs, and potassium-sparing diuretics like spironolactone all nudge potassium upward.
- 🧑⚕️ The clinician note — if any of these apply, keep potassium food-moderate and clinician-supervised, and never add potassium supplements without instruction.
🚨 Potassium is not for everyone
Kidney disease, dialysis, or medications that retain potassium — ask your clinician before loading. For everyone else, food sources beat pills on both safety and taste.
The Sodium-to-Potassium Ratio
Some researchers frame the whole problem as a ratio — sodium divided by potassium — with lower being better. It's a genuinely useful summary, but it deserves an honest label:
- 🔬 The observation — cohort data (NHANES III) links higher sodium:potassium ratios to worse cardiovascular mortality.
- ⚖️ Honest status — the ratio's independent value over its two halves is still debated; it's a summary statistic, not a trial-proven target.
- 🧭 Practical use — treat it as a compass: lower sodium, raise potassium, and the ratio improves itself. Aiming near 1:1 is a reasonable horizon, not a law.
- 🔢 The arithmetic — the typical American diet sits near a 1.5:1 ratio; cutting sodium toward 2,300 mg while raising potassium toward 3,500 mg brings it below 1:1. Same food changes, one tidy number.
- 📉 The same operations — nothing here changes the week's work. The ratio reframes it, which is exactly how a good summary should behave.
Where the Evidence Lives
This page is the operational layer — the underlying science has a home in the pillars, and this series references rather than repeats it:
- 🫀 Why sodium and potassium matter at all — the Blood Pressure science topic owns the physiology and the trial evidence.
- 🥗 The eating pattern — the DASH Diet page turns these two levers into a full plate.
- 🚶 The aerobic add-on — the Walking topic covers the exercise dose that stacks with the sodium cut.
- 😴 The apnea confounder — the Sleep Apnea topic explains the lever that can silently undo this one.
- 🩺 Reading the result — the Home Measurement page is how you judge whether the audit worked.
What to Do When It Goes Wrong
The audit fails in predictable ways — and each has a same-week fix:
- 🚩 Week 4 and the numbers haven't moved — salt sensitivity varies; roughly half of people respond strongly, others barely. Audit the honesty of the log (restaurant weeks?), confirm technique, add potassium and aerobic exercise, and re-judge at weeks 6–8.
- 🚩 Everything tastes like cardboard — the reset is working; weeks 3–6 are the valley. Herbs, acid, and heat from the flavor page carry you through it.
- 🚩 Kidney disease or potassium-retaining medications are in play — stop the potassium build and bring the plan to your clinician before continuing.
- 🚩 Eating out keeps blowing the budget — order plainly (grilled, sauces on the side, no added salt), assume 1,000+ mg per restaurant meal, and plan the rest of the day around it.
- 🚩 Label reading feels overwhelming — audit one shelf per week, use the 5% filter to do the ranking for you, and log mg only. No judgments in week one.
Questions, Answered Briefly
- ❓ Is sea salt or pink salt better? — No meaningful difference: all are 97–99% sodium chloride, and the trace minerals exist in amounts too small to matter for blood pressure.
- ❓ Should I take a potassium supplement? — Not without clinician direction. Food is safer, and over-the-counter potassium pills are capped at 99 mg each anyway.
- ❓ How quickly does sodium restriction move blood pressure? — One to two weeks for most responders, full effect by about four. Taste takes longer than pressure — plan for both timelines.
- ❓ My pressure barely moved — am I salt-resistant? — Partly, maybe: sensitivity varies with age, weight, and starting pressure. Judge at week 4 and stack the other levers rather than abandoning the cut.
The Bottom Line
- Most of your sodium isn't in the shaker — it's in packages, and the label tells you where.
- Audit for a week, then cut by steps for three more — the palate needs the staircase, not the cliff.
- Potassium from food is the second lever — beans, potatoes, and greens; skip the pills unless a clinician says otherwise.
- The ratio is a compass, not a verdict — lower sodium and raise potassium, and the ratio mostly takes care of itself.
This Page in One Workflow
- Audit — one week of logging mg from labels, no changes.
- Rank — the top three offenders in your own kitchen.
- Swap — replace them over weeks 2 and 3.
- Build — a potassium food at every meal.
- Judge — a 3-day blood pressure re-check at week 4 against the baseline.
The Daily Checklist
- Sodium logged in mg — every packaged item, no judgment
- One potassium hit at each meal — beans, potato, spinach, avocado, banana, yogurt
- Top-three swaps held — the lower-sodium bread, deli meat, and soup
- Condiments measured, not poured — soy sauce and dressing included
- No added salt at the table
- Morning and evening blood pressure pair on scheduled days
The Weekly Checklist
- One shelf audit — ten labels read, mg noted
- One batch cook — a no-salt-added soup or sauce for the week
- Restaurant plan made before the week starts
- 3-day blood pressure re-check averaged against baseline
- Clinician check-in if kidney disease, potassium-affecting meds, or supplements are in play
Go Deeper: The Sodium Audit & Potassium Build
These five companion pages turn the topic into smaller, testable practices.
- 🔗 The 2,300 mg ceiling, applied
- 🔗 The hidden-sodium map
- 🔗 The potassium counterweight
- 🔗 The salt-substitute option
- 🔗 The restaurant strategy
Related Topics
- Sacks FM, et al. "Effects on blood pressure of reduced dietary sodium and the Dietary Approaches to Stop Hypertension (DASH) diet," New England Journal of Medicine (2001)
- He FJ, MacGregor GA. "Effect of modest salt reduction on blood pressure: a meta-analysis of randomized trials. Implications for public health," Journal of Human Hypertension (2002)
- Aburto NJ, et al. "Effect of increased potassium intake on cardiovascular risk factors and disease: systematic review and meta-analyses," BMJ (2013)
- Cook NR, et al. "Sodium and potassium intake and mortality among US adults: prospective data from the Third National Health and Nutrition Examination Survey," Archives of Internal Medicine (2011)
- Filippini T, et al. "The effect of potassium supplementation on blood pressure in hypertensive subjects: a systematic review and meta-analysis," International Journal of Cardiology (2017)
- National Academies of Sciences, Engineering, and Medicine. Dietary Reference Intakes for Sodium and Potassium (2019)