DEXA vs Bioimpedance vs Calipers
Three devices all claim to answer the same question — how much of you is fat — and they can disagree with each other by eight percentage points for the same person on the same day. This page explains what each method physically measures, how big its error bars really are, and how to get the cheapest number that still tells the truth.
What the evidence supports
- DXA (dual-energy X-ray absorptiometry) is well validated against the four-compartment model, with repeat-scan error around 1–2 percentage points of body fat (Shepherd et al., Bone, 2017).
- Bioelectrical impedance tracks total body water well enough to follow trends, but absolute body-fat estimates carry roughly ±3–8% error against reference methods (Sun et al., Am J Clin Nutr, 2003).
- Skinfold equations have been validated in large samples since the 1970s, with accuracy concentrated in trained hands (Durnin & Womersley, Br J Nutr, 1974).
What remains uncertain
- No home device matches the precision of lab methods; consumer "muscle quality" and "metabolic age" readouts are mostly proprietary math on top of impedance.
- Individual error can exceed the population average — the same smart scale may misread one person by double digits while tracking another reliably.
Evidence last reviewed: August 15, 2026. Conclusions may change as new research is published.
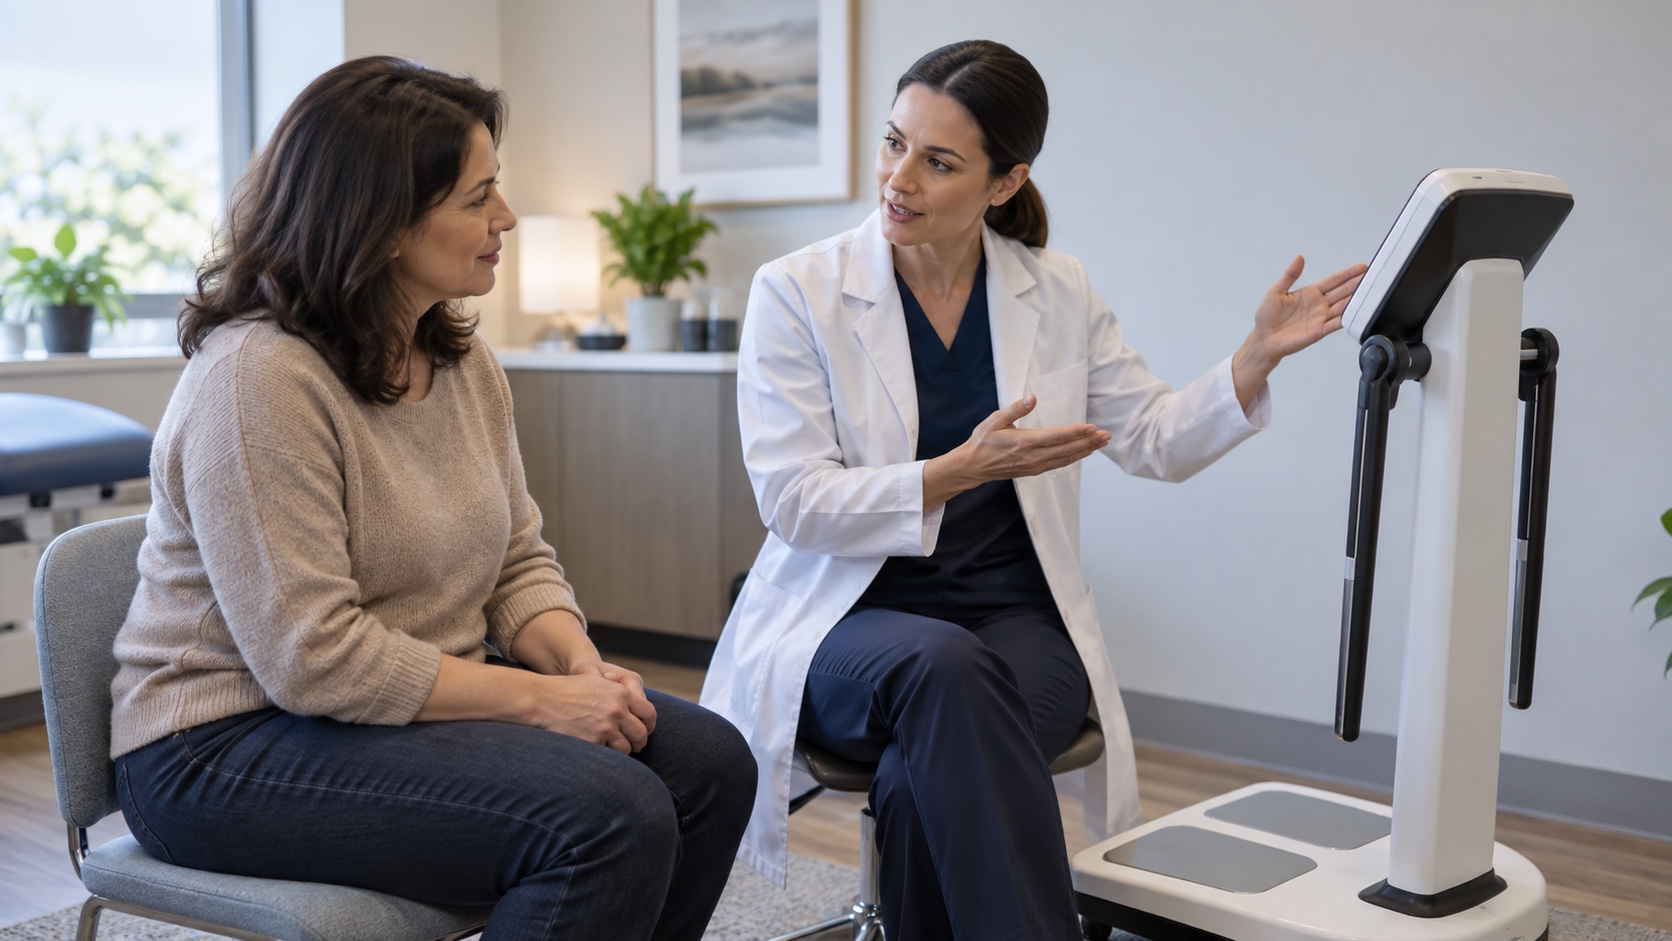
Product picks are generic categories, not brands. We may earn a commission on Amazon or iHerb purchases at no cost to you — this never changes our evidence conclusions. Full disclosure
Smart scale with body-composition estimates
Can make body-weight trends easier to observe; body-composition estimates may be used as a rough personal trend only.
⚠️ Bioimpedance estimates vary with hydration and device assumptions; frequent weighing can be unhelpful for people with eating-disorder risk or body-image distress.
Check price on Amazon →What Each Method Physically Measures
The three tools are not three versions of the same measurement. They are three different measurements that all get converted — through equations built on other people's bodies — into the same familiar number. DXA passes two low-energy X-ray beams through you and reads how much of each beam is absorbed; because fat, bone, and lean tissue attenuate the beams differently, software can estimate bone mineral, fat, and lean mass for the whole body and for each region. A scan takes roughly ten to twenty minutes and uses a radiation dose far below a day's natural background exposure. It is the field test the other methods are judged against.
- ⚡ Bioimpedance: sends a weak, painless alternating current through the body. Fat resists current; water-rich tissue conducts it. From the resistance, the device estimates total body water, then lean mass, then fat by subtraction. A bathroom scale only measures leg-to-leg — the upper body is extrapolation.
- 🫰 Calipers: pinch skin plus the fat directly beneath it at three to seven standardized sites and sum the millimeters. Equations built on body-density studies (the four-site set from Durnin and Womersley) convert that sum to body density, then to fat percentage. Calipers see only subcutaneous fat and assume it scales with total fat.
- 📏 The tape measure: technically not a fat estimator at all — it measures the waist, the single distribution measure that best predicts metabolic risk. It earns its place in every comparison because it is free and repeatable.
The shared limitation: every method measures a proxy and runs it through a model built on other people. None of them "sees" your fat directly.
The Error Bars, Honestly
What does "±3%" mean in practice? If a scale reads 25% with ±3% error, the lab value is plausibly anywhere from 22% to 28% — and for some individuals the miss is larger than the average. In validation studies, consumer bioimpedance devices show errors of roughly 3–8 percentage points against multicomponent reference methods (Sun et al., Am J Clin Nutr, 2003; NIH Technology Assessment, 1996). DXA repeats within 1–2 points (Shepherd et al., Bone, 2017), and calipers in trained hands land around 3–4 points (Durnin & Womersley, Br J Nutr, 1974). The chart below shows the typical bands side by side.
Two practical consequences follow. First, a single reading is a guess with a range, not a verdict — a difference under three points between two measurements may be pure noise. Second, error is often not random for you personally: if your scale reads four points high, it tends to read high every morning. That consistency is exactly what makes trends usable even when absolute numbers are not.
Flexible body-measurement tape
Can help track waist circumference when a person and clinician choose to monitor it.
⚠️ Can encourage unhelpful body checking for some people; a measurement is a risk marker, not a diagnosis or a worth score.
Check price on Amazon →Where Each Method Goes Wrong
- 💧 Hydration is bioimpedance's master variable. Dehydrated tissue conducts current worse, and the device reads that as more fat. Sweating, a salty dinner, alcohol the night before, or measuring right after waking can shift the reading by several points.
- 🧮 Equation mismatch. Impedance equations are built on specific populations. Older adults, very athletic people, and anyone outside the equation's original sample get systematically misread.
- ✋ The operator is the caliper's error bar. Pinch depth, site placement, and reading speed vary between people — and even between sessions by the same person. Expect a few points of drift with a new operator.
- 🦴 DXA has software disagreements. Different manufacturers and software versions can shift results by a couple of points. Compare only scans from the same machine.
- 📈 Noise mistaken for change. A 1.5-point drop between two days is usually water, not fat. Only same-condition trends — morning, fasted, after voiding — deserve interpretation.
How We Know Any of It Works
The validation chain runs from a lab method called the four-compartment model — which measures body density, total body water, and bone mineral separately and is treated as the reference — down to the field devices. DXA has been validated against it and serves as the reference-standard field test (Shepherd et al., Bone, 2017; Toomey et al., Topics in Clinical Nutrition, 2015). The bioimpedance equations inside most consumer devices were derived by fitting impedance data against multicomponent measurements in roughly 1,800 adults (Sun et al., Am J Clin Nutr, 2003), and a 1996 NIH technology assessment spelled out the conditions under which impedance is trustworthy: hydrated, rested, consistent. Skinfold equations were likewise built against density measurements in 481 men and women (Durnin & Womersley, Br J Nutr, 1974). The lesson: every field number is a shadow cast by a better lab number, and the shadow is sharpest when your measuring conditions match the ones used to build the equation.
Reading Your Number
Body-fat percentage is simply the share of your mass that is fat — nothing more. It is not a health grade by itself; a marathoner and a frail older adult can carry identical percentages. The number earns meaning three ways: against the healthy ranges for your age and sex, as a trend over months measured under identical conditions, and beside its partners — waist circumference and strength. Two rules keep readings honest. Never mix devices: a DXA result and a smart-scale result are different currencies, and comparing them is how people conclude they lost 5% body fat in a weekend. And never interpret a single reading: the actionable unit of body-composition data is the three-to-six-month slope, which is why the quarterly audit's body-metrics routine spreads measurements across the year rather than the week.
⚠️ When the number becomes the problem
Body-composition numbers are tools, not grades. If tracking produces dread, daily weigh-ins, or restrictive eating, step back — and if you have a history of disordered eating, consider skipping the numbers entirely and working with a clinician on non-scale goals. Population ranges describe populations; your targets are a clinical conversation, not a chart reading.
A Practical Stack
For most people the value-per-dollar ordering is clear: tape monthly, DXA annually if convenient, smart scale as a daily trend only. The table is the whole decision, honestly graded.
| Method | What it measures | Typical error | Verdict for most people |
|---|---|---|---|
| 📏 Tape measure | Waist and waist-to-height — the fat distribution that predicts risk | ±1–2 cm if consistent | Strong value — monthly, free |
| 🔬 DXA | Bone, lean, and fat mass by body region | ±1–2% body fat | Strong — annually if convenient |
| ⚡ Bioimpedance scale | Impedance → estimated water, lean, and fat | ±3–8% body fat | Variable — trends only |
| 🫰 Skinfold calipers | Subcutaneous fat at 4–7 pinch sites | ±3–4% body fat, trained hands | Moderate — operator-dependent |
| 📱 "Muscle quality" app scores | Proprietary math on top of impedance | Unvalidated | Weak — entertainment |
When It's Worth Paying
A sensible budget tiers by what you actually get. The tape measure costs a few dollars and gives you the trend that matters most. A decent impedance scale runs in the tens of dollars, and its honest value is the daily trend, not the percentage. Calipers are cheap but worthless without a trained operator — a few sessions with a coach who uses them well beats owning a pair you pinch badly. DXA is the premium tier: typically tens to low hundreds of dollars per scan depending on where you live, and worth it one to two times a year if you want a trustworthy absolute number to anchor the trend — especially around a deliberate body-composition phase (the recomp, cut, or bulk decision is where a real measurement earns its keep). Skip everything that claims to grade your "metabolic age" or "muscle quality" from a bathroom scale: those numbers are not validated against anything, and they add noise where you need signal.
Questions, Answered Briefly
- ❓ Is DXA worth it? ✅ For a once- or twice-a-year trend, yes — it is the reference-standard field test, and one DXA per year plus a monthly tape gives you both the trend and the calibration.
- ❓ My scale says 22% and the gym's handheld says 30%. Which is right? ✅ Possibly neither, in absolute terms. Different devices, equations, and hydration states routinely disagree by several points. Pick one device and one set of conditions, and follow the direction.
- ❓ Can I trust my smart scale's muscle mass? ✅ No. Lean-mass estimates inherit all of bioimpedance's hydration error and add a subtraction step. Direction over months, at best.
- ❓ What's the cheapest accurate measurement? ✅ The tape measure at the waist, once a month, same spot. It tracks the fat distribution that best predicts metabolic risk — and it costs almost nothing.
The Bottom Line
- DXA is the reference-standard field test — roughly 1–2% repeat error; use it once or twice a year to anchor a trustworthy trend.
- Smart scales are trend machines, not lab results — ±3–8% error driven mostly by hydration; ignore the absolute percentage.
- Calipers are only as good as the hand on them — excellent with trained operators, noisy for everyone else.
- The tape measure remains the best value — free, repeatable, and it tracks the fat distribution that actually predicts risk.
Related Topics
- Shepherd et al., "Body composition by DXA," Bone (2017)
- Toomey et al., "A review of body composition measurement in the assessment of health," Topics in Clinical Nutrition (2015)
- Sun et al., "Development of bioelectrical impedance analysis prediction equations for body composition with the use of a multicomponent model for use in epidemiologic surveys," Am J Clin Nutr (2003)
- National Institutes of Health Technology Assessment Conference, "Bioelectrical impedance analysis in body composition measurement," Am J Clin Nutr (1996)
- Durnin & Womersley, "Body fat assessed from total body density and its estimation from skinfold thickness: measurements on 481 men and women aged from 16 to 72 years," Br J Nutr (1974)
- Kyle et al., "Bioelectrical impedance analysis — part I: review of principles and methods," Clinical Nutrition (2004)