The Scale's Blind Spots
Your scale measures everything and sees nothing: water, glycogen, last night's dinner, and body fat all weigh the same on the way down. This page explains what the number actually contains, why a single reading means almost nothing, and which three cheap scoreboards — waist, photos, and strength — actually track your body composition.
What the evidence supports
- Glycogen is stored with roughly 3–4 grams of water per gram, so carbohydrate intake swings body weight by kilograms without touching fat (Kreitzman et al., Am J Clin Nutr, 1992).
- Sodium balance oscillates on multi-day rhythms, moving water weight independently of fat (Rakova et al., Cell Metab, 2013).
- Waist-to-height ratio — keep waist under half your height — tracks cardiometabolic risk better than weight or BMI alone (Ashwell & Gibson, BMJ Open, 2016).
What remains uncertain
- The exact magnitude of day-to-day swings varies widely between people — 1–2 kg is typical, not universal.
- Regular self-weighing is associated with better weight outcomes in observational data, but the optimal frequency for a given person is a preference, not a finding.
- No scoreboard — scale, tape, photo, or strength test — is validated as a stand-alone health measure; they work as a set.
Evidence last reviewed: August 15, 2026. Conclusions may change as new research is published.
Product picks are generic categories, not brands. We may earn a commission on Amazon or iHerb purchases at no cost to you — this never changes our evidence conclusions. Full disclosure
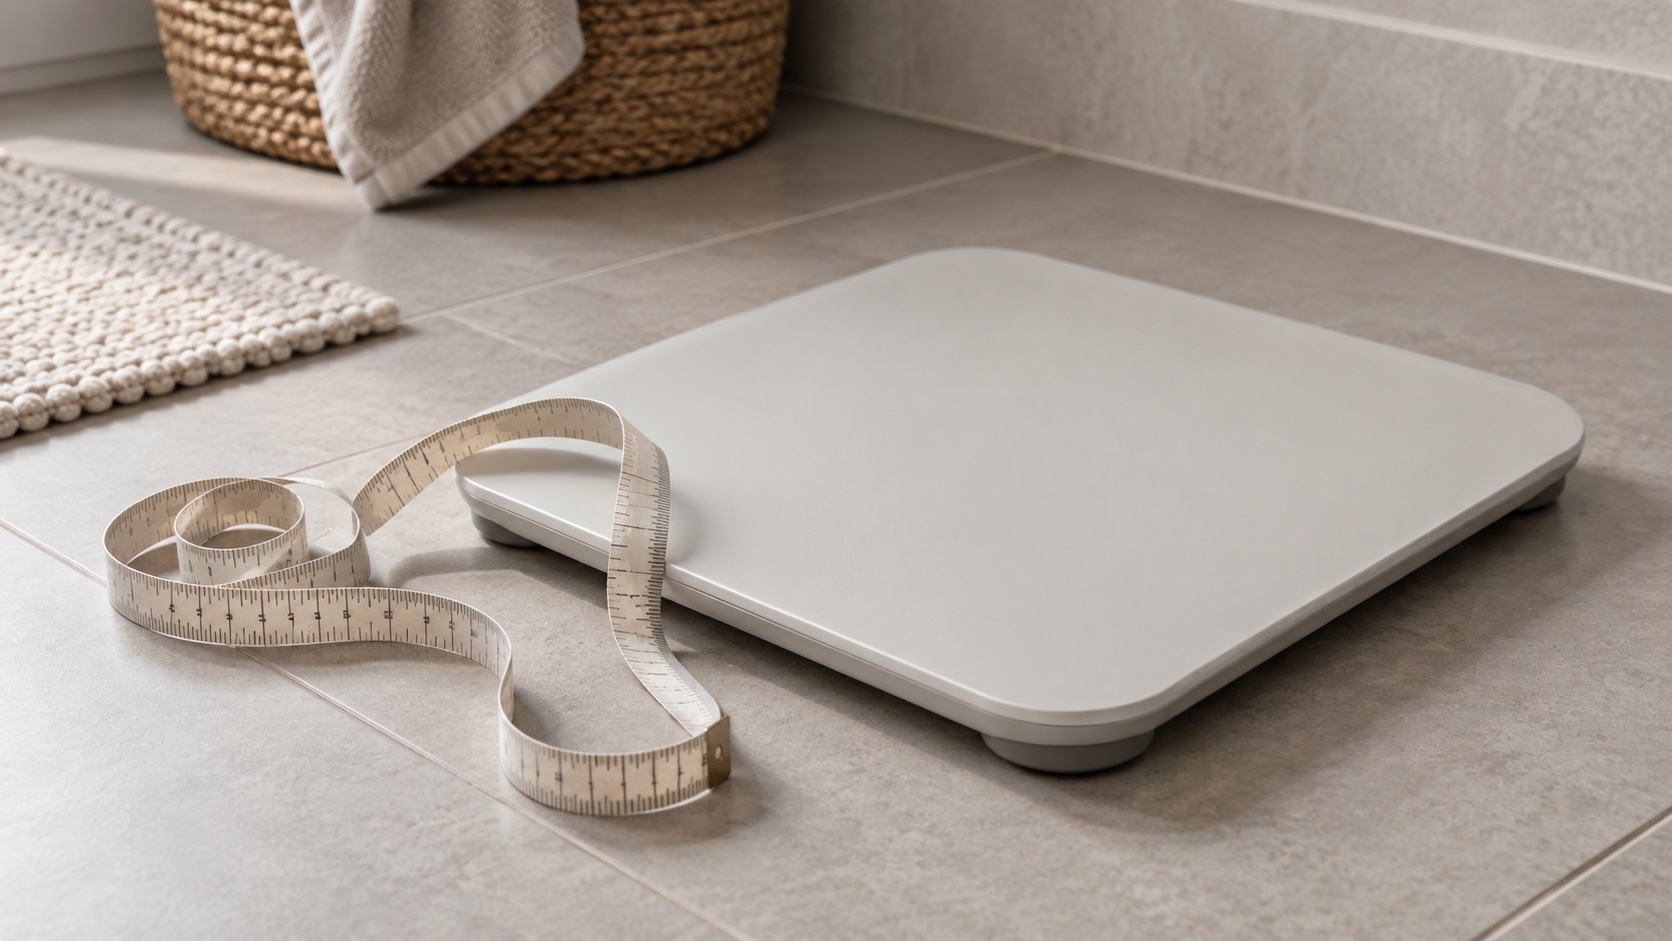
Smart scale with body-composition estimates
Can make body-weight trends easier to observe; body-composition estimates may be used as a rough personal trend only.
⚠️ Bioimpedance estimates vary with hydration and device assumptions; frequent weighing can be unhelpful for people with eating-disorder risk or body-image distress.
Check price on Amazon →What the Scale Actually Measures
A scale measures one thing: the total force your body presses down with, converted to kilograms. It cannot tell you what any of those kilograms are. On any given morning the number is the sum of bone, muscle, and organ mass — the parts that change slowly — plus fat, plus four fast-moving passengers: stored glycogen and its bound water, total body water shifted by sodium and hormones, food and fluid still in transit, and the day's clothing. The slow parts change on the scale of months; the passengers change by the hour. The chart shows the typical magnitudes of the fast-moving passengers against the one number you actually care about.
The arithmetic explains the daily heartbreak: the noise is twenty to thirty times larger than the signal. A "1.5 kg gain overnight" is not a diet failure — it is glycogen and salt doing their jobs.
The Daily Noise
The passengers have predictable schedules. Glycogen — the body's stored carbohydrate — holds roughly three to four grams of water per gram, so a big pasta dinner can add a kilogram by morning and a low-carb week can shed it just as fast; early diet "losses" are largely this water (Kreitzman et al., Am J Clin Nutr, 1992). Sodium runs on its own slower clock: careful balance studies in humans show sodium and its water oscillate on multi-day rhythms even when intake is constant (Rakova et al., Cell Metab, 2013), which is why a salty weekend shows up on Monday's scale and evaporates by Thursday. Add food and fluid in transit, hormonal shifts across the menstrual cycle and menopause, and the after-effects of hard training (muscle inflammation holds water while it repairs), and you have a measurement whose day-to-day movement is mostly story, not fact. The rule that follows: read the trend, never the day. Week-over-week averages, taken under identical conditions, are the smallest unit worth an emotion.
The Waist: The Free Upgrade
If you measure one thing with a tape, measure the waist: midpoint between the lowest rib and the top of the hip bone, after a normal exhale, same spot every time. The waist-to-height ratio is the sleeper metric — keep your waist under half your height, roughly, and cardiometabolic risk stays in better territory regardless of what the scale says; a systematic review found the simple ratio outperformed BMI and waist circumference alone as an early-risk screen (Ashwell & Gibson, BMJ Open, 2016). The waist also sees recomposition before the scale does: in a recomp, weight sits flat while the waist drops a centimeter a month, because fat is leaving the middle as muscle arrives elsewhere. A scale will call that "no progress" for an entire year. The visceral fat topic explains why the middle is the part worth watching in the first place.
The Mirror and the Photos
Photos are the scoreboard with memory. The protocol is deliberately boring: same room, same light, same distance, same pose, once a month, front and side — no flexing for the camera, no favorable angles, because the point is comparison, not presentation. Monthly photos catch what neither scale nor tape can express: shape changes, posture, how your clothes carry. The honest caveats: perception lags reality in both directions — people often see no change for months while measurements improve, then suddenly see a different person — and the mirror alone is the weakest instrument of all, because mood edits what it shows. Use photos as the archive, not the judge; let the tape and the strength tests hold the gavel. A year of monthly photos is the single most persuasive record most people ever build, which is why the quarterly audit's tracking sheets include them.
Strength: The Function Scoreboard
The scoreboard that matters most for longevity has no units of mass: grip strength, chair-rise time, and single-leg balance are the hidden vital signs — they predict outcomes better than any machine's lean-mass estimate, and they are free to measure. The recomp signature shows up here first: waist down, weight flat, and the numbers climbing — a faster chair-rise, a firmer grip, a longer one-leg stand — is body composition improving in exactly the direction that pays at 80. The stability topic supplies the tests and norms. When the scale stalls for a month, these are the numbers that tell you whether the stall is a real plateau or a fat-for-muscle swap in progress.
⚠️ When weighing becomes the problem
If the morning number is steering your mood or your food choices, widen the interval — weekly or monthly weighing carries nearly all the information with a fraction of the noise. And if you have a history of disordered eating, the scale may not belong in your house at all; a clinician can help you track progress without it. The scoreboards on this page are optional tools, not obligations.
The Monthly Ritual
The whole system fits in ninety seconds on the first morning of each month, before breakfast: weigh, measure the waist at the standard spot, divide waist by height. Write the three numbers somewhere permanent — the tracking sheets from the quarterly audit exist for exactly this — and photograph the front and side while you're at it. Once a quarter, add the free function tests: grip, single-leg balance, chair-rise (the body-metrics page has the full protocol). Once a year, optionally, a DXA scan to calibrate everything else. Twelve three-number entries a year will show you metabolic trouble coming years before any single weigh-in could — and they will do it without a single day of scale anxiety.
When the Scale Lies the Loudest
- 🧂 After travel or a salty weekend: sodium and cabin pressure both move water; expect a phantom kilo or two that leaves on its own.
- 🏋️ After starting a new lifting block: muscle inflammation and glycogen loading add water weight that reads as "gained fat" for the first weeks — it is the opposite.
- 🌙 Across the menstrual cycle: the scale can swing a kilogram or more on hormones alone; compare month to month, not week to week.
- 🍝 After a big dinner: food in transit plus glycogen-bound water can add a kilo by morning. A real kilo of fat needs roughly a week of heavy overeating, not one meal.
- 🤒 After illness or poor sleep: both shift water and stress hormones; weigh-in days are bad diagnostic days. Same conditions, or skip the reading.
Questions, Answered Briefly
- ❓ I "gained" 1.5 kg overnight. Did I blow my diet? ✅ No. That is water, glycogen, and salt — a real 1.5 kg of fat requires a sustained surplus over days, not one dinner. Trend is the verdict; the day is weather.
- ❓ My weight is flat but my waist is down 3 cm. Is that progress? ✅ Yes — that is recomposition in progress: fat leaving the middle while muscle arrives elsewhere. Keep going.
- ❓ How often should I weigh myself? ✅ Weekly or monthly, same conditions (morning, fasted, after voiding). Daily weighing works for people who can read trends without reacting — observational data link regular self-weighing to better outcomes — but no one needs it.
- ❓ Is BMI useless, then? ✅ Not useless — a cheap population screener. For individuals it misclassifies the muscular and the skinny-fat, so pair it with the waist, which is where the pillar topic starts.
The Bottom Line
- The daily number is mostly water — glycogen, sodium, and food transit swing weight by kilograms while real fat moves in grams.
- Read the trend, never the day — same conditions, week over week or month over month, is the smallest unit worth an emotion.
- The waist sees what the scale hides — waist under half your height, measured monthly, catches recomposition and visceral risk the scale cannot.
- Strength is the scoreboard that pays at 80 — grip, chair-rise, and balance track the muscle function that actually predicts outcomes.
Related Topics
- Kreitzman et al., "Glycogen storage: illusions of easy weight loss, excessive weight regain, and distortions in estimates of body composition," Am J Clin Nutr (1992)
- Rakova et al., "Long-term space flight simulation reveals infradian rhythmicity in human Na+ balance," Cell Metab (2013)
- Ashwell & Gibson, "Waist-to-height ratio as an indicator of 'early health risk': simpler and more predictive than using a 'matrix' based on BMI and waist circumference," BMJ Open (2016)
- Helander et al., "Are breaks in daily self-weighing associated with weight gain?" PLOS One (2014)
- Borga et al., "Advanced body composition assessment: from body mass index to body composition profiling," J Investig Med (2018)
- World Health Organization, "Waist circumference and waist–hip ratio: report of a WHO expert consultation" (2008)