DEXA & the T-Score
A bone density report arrives in the mail full of numbers, and most people read exactly one of them. This page is a line-by-line tour: what the machine actually measures, what the T-score and Z-score really mean, where the scan quietly flatters you, and how big a change has to be before it means anything at all.
What the evidence supports
- Lower bone density predicts higher fracture risk in a graded, continuous way — every step down the T-score scale carries more risk.
- The T-score compares you to young-adult peak density in standard deviations; the −2.5 diagnostic line is a 1994 convention, not a biological cliff.
- Repeat scans are only meaningful once the least-significant-change threshold — typically a few percent — is crossed.
What remains uncertain
- How often to rescan — guidelines disagree, and density changes slowly.
- How much of fracture risk is captured by density alone — bone structure and fall risk add substantial, harder-to-measure information.
- Whether treating based on density change — rather than absolute risk — improves outcomes.
Evidence last reviewed: August 15, 2026. Conclusions may change as new research is published.
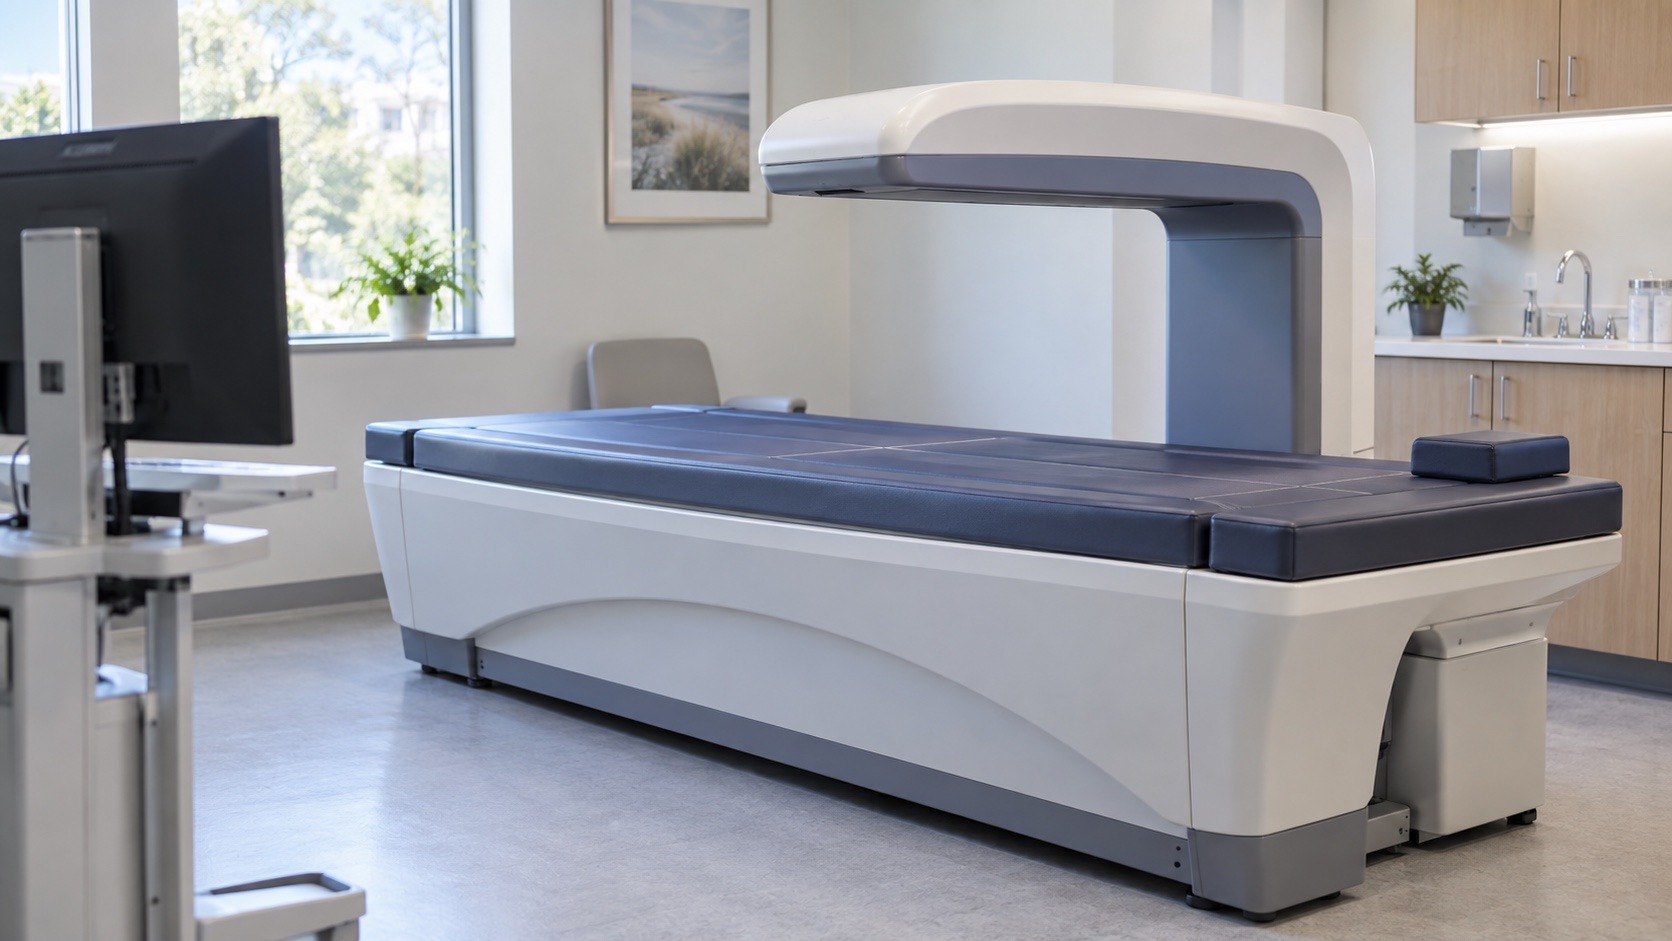
What the Machine Actually Measures
DEXA passes two X-ray beams of different energies through the body and measures how much each is absorbed, which lets the machine subtract soft tissue and isolate bone mineral. The result is an areal density — grams of mineral per square centimeter — projected onto a flat image, not the true three-dimensional density of the bone. Two consequences follow. First, bigger bones register denser even when their material is identical, one reason size-adjusted reference ranges exist. Second, the measurement is a useful proxy rather than ground truth — good enough that density predicts fracture risk in a graded way, coarse enough that it cannot see the architecture the Remodeling Ledger page describes. Radiation exposure is trivial — a few microsieverts, a small fraction of a chest X-ray — so the scan's cost is time and money, not risk. A standard study images the lumbar spine (usually L1–L4) and one hip, and sometimes the forearm, each site reported separately.
The T-Score, Unpacked
The T-score is a translation step: your measured density, minus the average density of a healthy young adult woman, divided by the standard deviation of that reference population. A T-score of 0 means you sit exactly at the reference average; −1 means one standard deviation below it — roughly 10–12% less bone mineral per unit. The World Health Organization defined osteoporosis in 1994 as a T-score at or below −2.5, osteopenia as the band between −1.0 and −2.5, and normal as −1.0 or above (WHO Study Group, 1994). Two honest glosses matter. First, −2.5 is a convention chosen because it aligns roughly with the population's lifetime fracture burden — it is an operational line, not the point where bone suddenly becomes fragile; risk climbs continuously all the way down. Second, the bands apply per site, and standard practice is to classify by the lowest measured site — spine, total hip, or femoral neck. The parent topic Bone Health & Osteoporosis carries the full band table; the deeper point here is what the number cannot say: a T-score is a comparison against thirty-year-olds, and for a seventy-year-old it is mostly a statement about time.
The Z-Score: The Age-Matched Question
Where the T-score compares you to peak, the Z-score compares you to your age peers. A Z-score of −2.0 or lower — two standard deviations below what is expected for your age — is the report's way of asking a different question: why is this person losing faster than her contemporaries? Menopause explains a lot of loss for everyone, but a very low Z-score raises the possibility of something additional: malabsorptive conditions such as celiac disease, an overactive parathyroid, myeloma, medications including long-term glucocorticoids or aromatase inhibitors, or an earlier-than-realized menopause. The follow-up — targeted labs, sometimes referral — is clinician territory by design, and it is the one line of the report that most rewards a conversation rather than a solo read.
Reading the Report Line by Line
Reports vary in format but carry the same core lines. Here they are, with what each one is actually for:
| Line on the report | What it actually means | The honest reaction |
|---|---|---|
| T-score, lumbar spine | Density versus young-adult peak at the fastest-changing site — the first place losses show, and the first place artifacts creep in | Track |
| T-score, total hip / femoral neck | The hip number — steadier, more predictive of hip fracture, and the density input for FRAX | Key number |
| Z-score | Density versus age-matched peers — a very low value flags possible causes beyond menopause | Context |
| BMD in g/cm² | The raw areal density behind every score — the same number will be re-measured at follow-up | Raw input |
| FRAX or fracture probability | Your ten-year odds of major and hip fracture, when the report includes the calculation | Decides |
If the report omits the probability, the numbers still feed the public calculator the Fracture Math page describes — and that ten-year probability, not any single T-score, is what treatment decisions should hang on.
When the Spine Flatters You
The lumbar spine is the most informative site — and the easiest to misread. Osteoarthritis, disc degeneration, bone spurs, and even aortic calcification all add apparent density to a spine scan, because the machine cannot tell mineralized bone from mineralized trouble. A compressed vertebral fracture does the same, packing mineral into a smaller area. The telltale sign is discordance: a spine T-score that looks far better than the hip, or a spine number that rises implausibly from one scan to the next. In such cases the hip becomes the more trustworthy site, and when spine and hip are both unreliable — severe arthritis, orthopedic hardware, or very high body weight — the forearm offers a fallback, since the radius is mostly cortical bone and comparatively artifact-free. One more layer some reports now include is the trabecular bone score, a texture measurement of the spine image that appears to add risk information beyond density — early evidence is encouraging, and it is not yet a decision driver on its own.
The Smallest Change That Means Anything
Every measurement carries error. For DEXA, the day-to-day precision error is roughly one percent at good facilities — and the rule of thumb is that a real change must exceed about 2.8 times that error to be detectable, the "least significant change" (LSC). That puts the honest threshold at a few percent depending on the site — which has a blunt consequence: a scan repeated one year later can rarely confirm anything but a catastrophe. Bone moves slowly, and so should your scanning calendar.
When to Scan, and When to Rescan
Screening guidance is genuinely simple: the US Preventive Services Task Force recommends a first DEXA for all women at 65, and earlier — at or after menopause — for those with elevated risk: a prior low-trauma fracture, early menopause, long-term glucocorticoid use, low body weight, a parental hip fracture, smoking, or heavy alcohol use (USPSTF, JAMA, 2025). The full earlier-testing list lives in the Screening & Prevention topic. Rescanning logic follows from the LSC math: roughly every two years is the minimum defensible interval, and if a first scan is reassuring, stretching the gap is reasonable — guidelines disagree, but nobody of note recommends annual scans. Between scans, the highest-value activity is not watching the number; it is working the levers the training page and the drug tier page lay out, so the next scan — whenever it comes — has something to measure.
⚠️ One number is not a diagnosis
A T-score is a risk marker, and risk markers get read in context: age, fracture history, Z-score, medication list, and the ten-year probability all change what the same −2.3 means. Interpreting your report — especially a low Z-score, an unexpected fracture, or any medication decision — is clinician territory, and no line on this page replaces that conversation.
Questions, Answered Briefly
- 🦴 My T-score is −1.7 — is that a disease? No. Osteopenia is a risk marker, not a diagnosis — the same category as an elevated cholesterol. It is a signal to act on the levers, not a sentence.
- 📊 Why does my report list three different T-scores? Because each site is measured separately, and the lowest one governs classification. Site disagreement is also useful: it can flag the spine artifacts described above.
- ⏱️ How often should I rescan? At minimum, wait until a real change could show — roughly two years, longer if your numbers are stable. Annual scanning mostly documents noise.
- 🏥 Can I compare scans from different machines? Poorly — machines and facilities differ, which is why repeat scans on the same machine are the rule of thumb. If you switch facilities, treat the first new scan as a fresh baseline.
- 🧪 Should I also get bone marker tests? Not routinely. Markers are for specific questions — see the Remodeling Ledger page — and a clinician should be the one asking them.
The Bottom Line
- DEXA measures areal density — a powerful proxy, not ground truth — it predicts fracture risk in a graded way but cannot see bone architecture.
- The T-score is a comparison against young-adult peak — and −2.5 is an operational convention, with risk climbing continuously below and above it.
- The Z-score is the report's most useful question — a very low one flags causes beyond menopause that deserve a clinician's workup.
- Only changes bigger than a few percent are real — the least-significant-change math makes annual rescanning mostly theater, and trend-watching a two-year game.
Related Topics
- World Health Organization Study Group, "Assessment of fracture risk and its application to screening for postmenopausal osteoporosis," WHO Technical Report Series (1994)
- Cummings SR et al., "Clinical use of bone densitometry: scientific review," JAMA (2002)
- International Society for Clinical Densitometry, "Official Positions — adult" (2019)
- Kanis JA et al., "FRAX and the assessment of fracture probability in men and women from the UK," Osteoporosis International (2008)
- US Preventive Services Task Force, "Screening for osteoporosis to prevent fractures: recommendation statement," JAMA (2025)